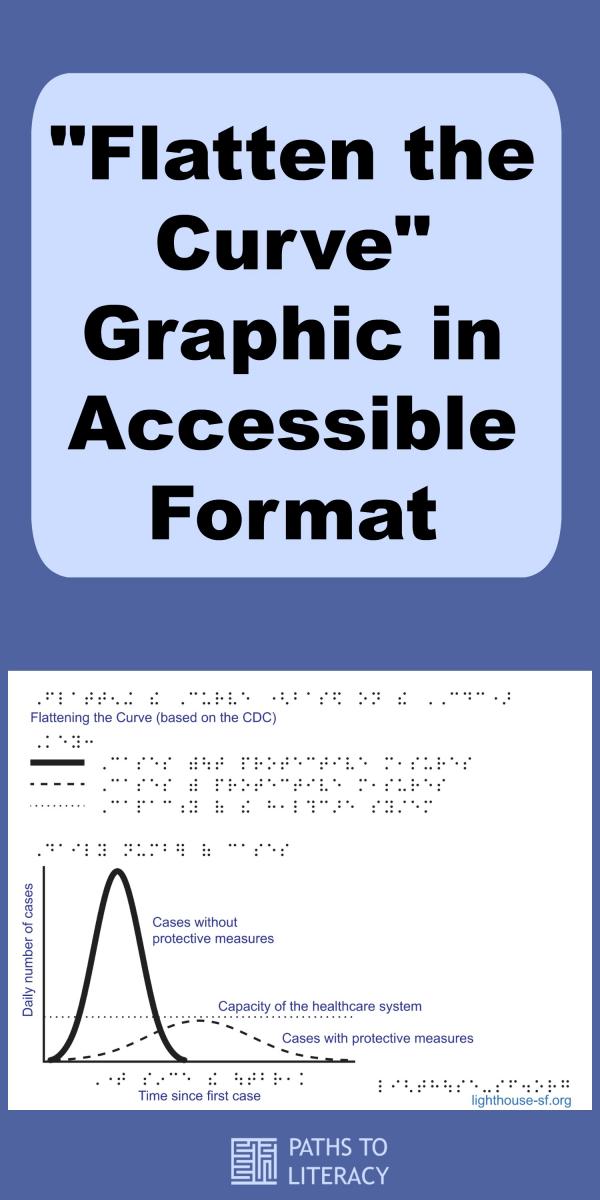
"Flatten the Curve" Graphic in Accessible Format
This week there has been a great deal of discussion in the news about the need to "flatten the curve", but this concept relies on visual images and graphs to illustrate the point. Our World in Data shares a graphic of why this is so critical now in order to combat COVID-19 and the coronavirus, that illustrates this with a chart showing the capacity of the healthcare system to respond without protective measures in a sharp spiked curve with a lower, flatter curve showing with protective measures.

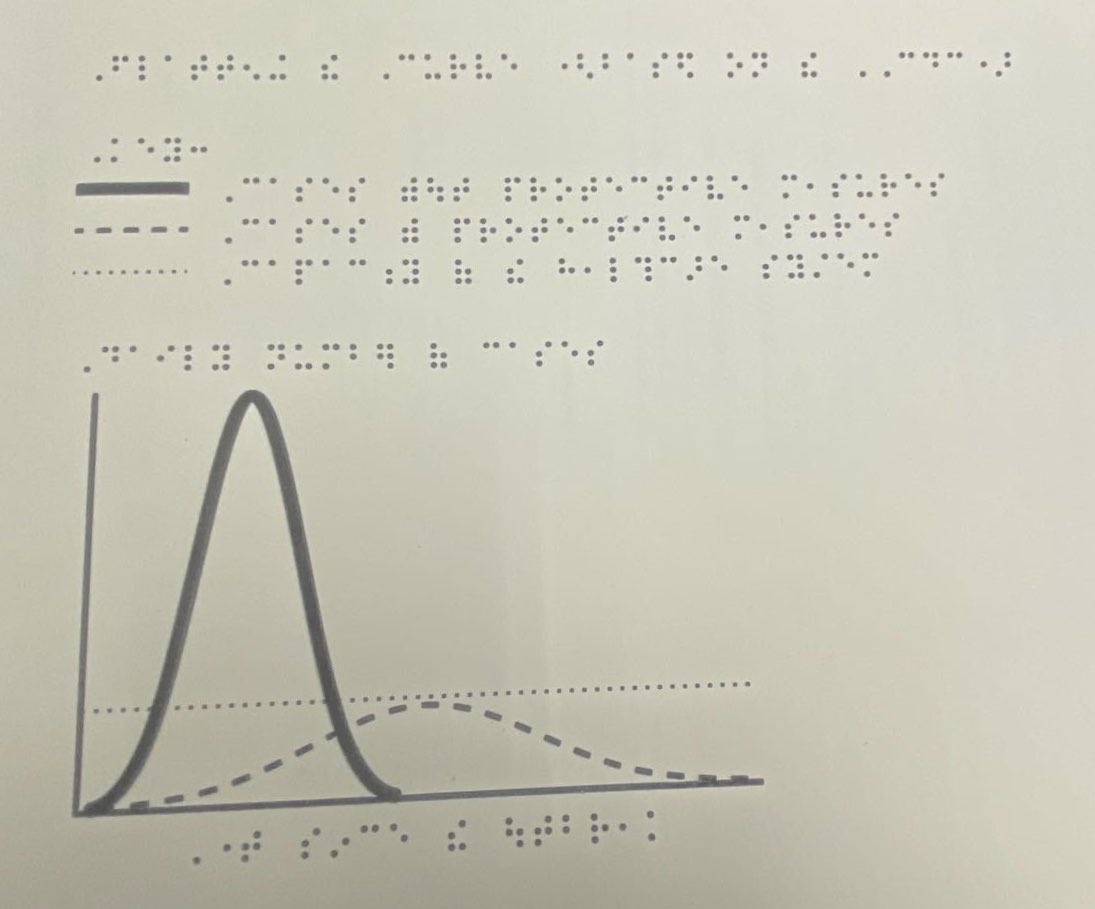
Download and Print Accessible Tactile Graphics
Tactile designer Naomi Rosenberg, who works at Lighthouse for the Blind and Visually Impaired, created a tactile version of this graph, which is available to download and print, using an embosser or swell paper.

Special thanks to Chancey Fleet, who is the president of NFB (National Federation of the Blind) Tech Trainers' Division, for sharing this on Twitter. This was Chancey's idea and she requested that Naomi Rosenberg create this tactile graphic.