Creating Large Print and Tactile Graphs
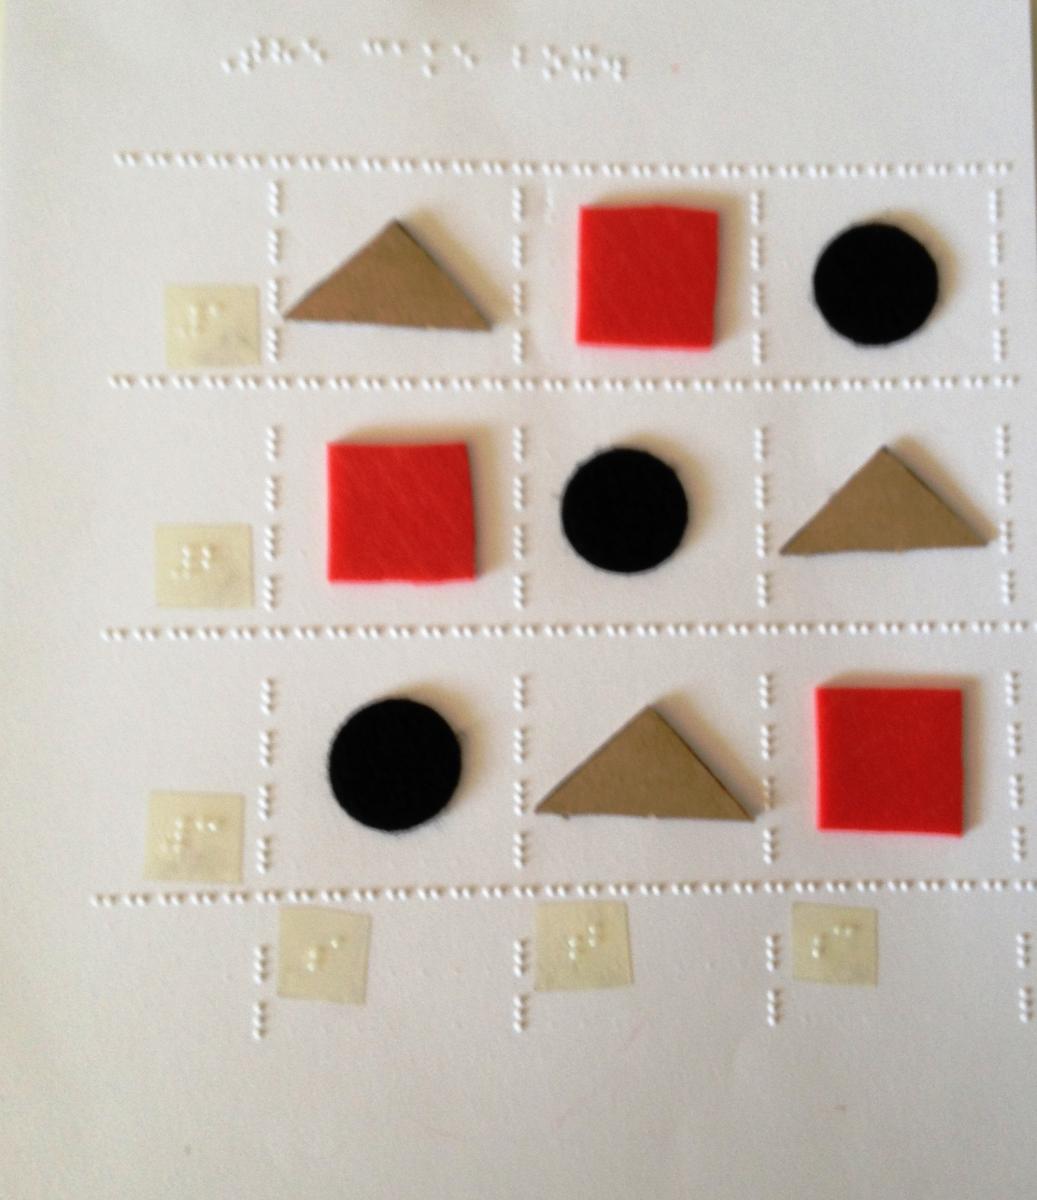
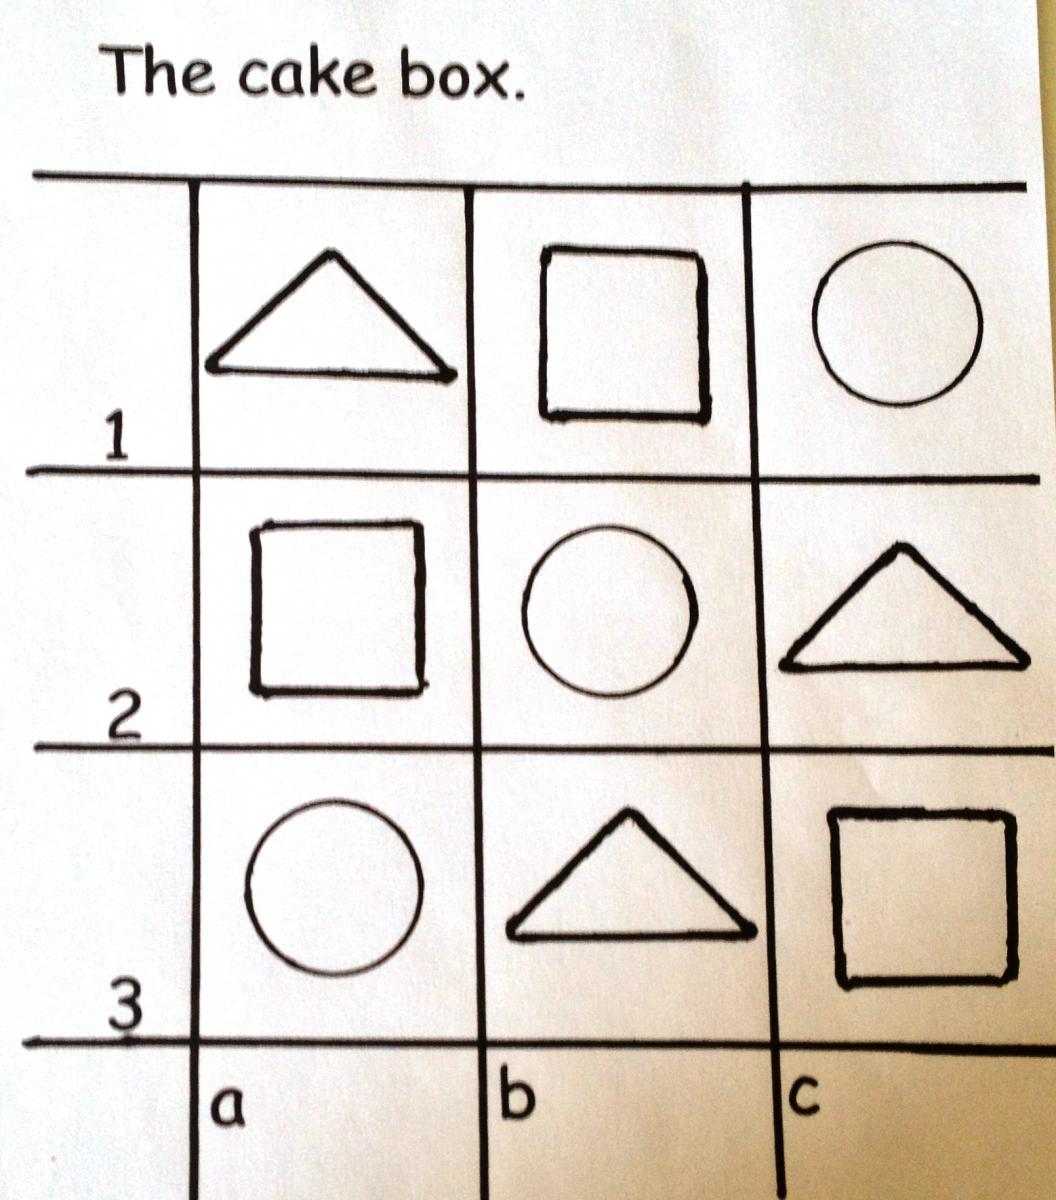
Graphs and charts can be very challenging for students who are blind or visually impaired, whether they are using tactile graphs or large print graphs. Students with visual impairments must be specifically taught how to interpret tactile graphics and these skills are essential to success in later grades in all subjects, but especially in math and science.
In this post I have included examples of different types of graphs and charts, including pie chart, tally charts, bar graphs, co-ordinates, and line graphs, at both the primary and secondary school levels. Examples are included for tactile graphs and charts, as well as large print versions for each.
Pie Charts
Primary Pie Charts
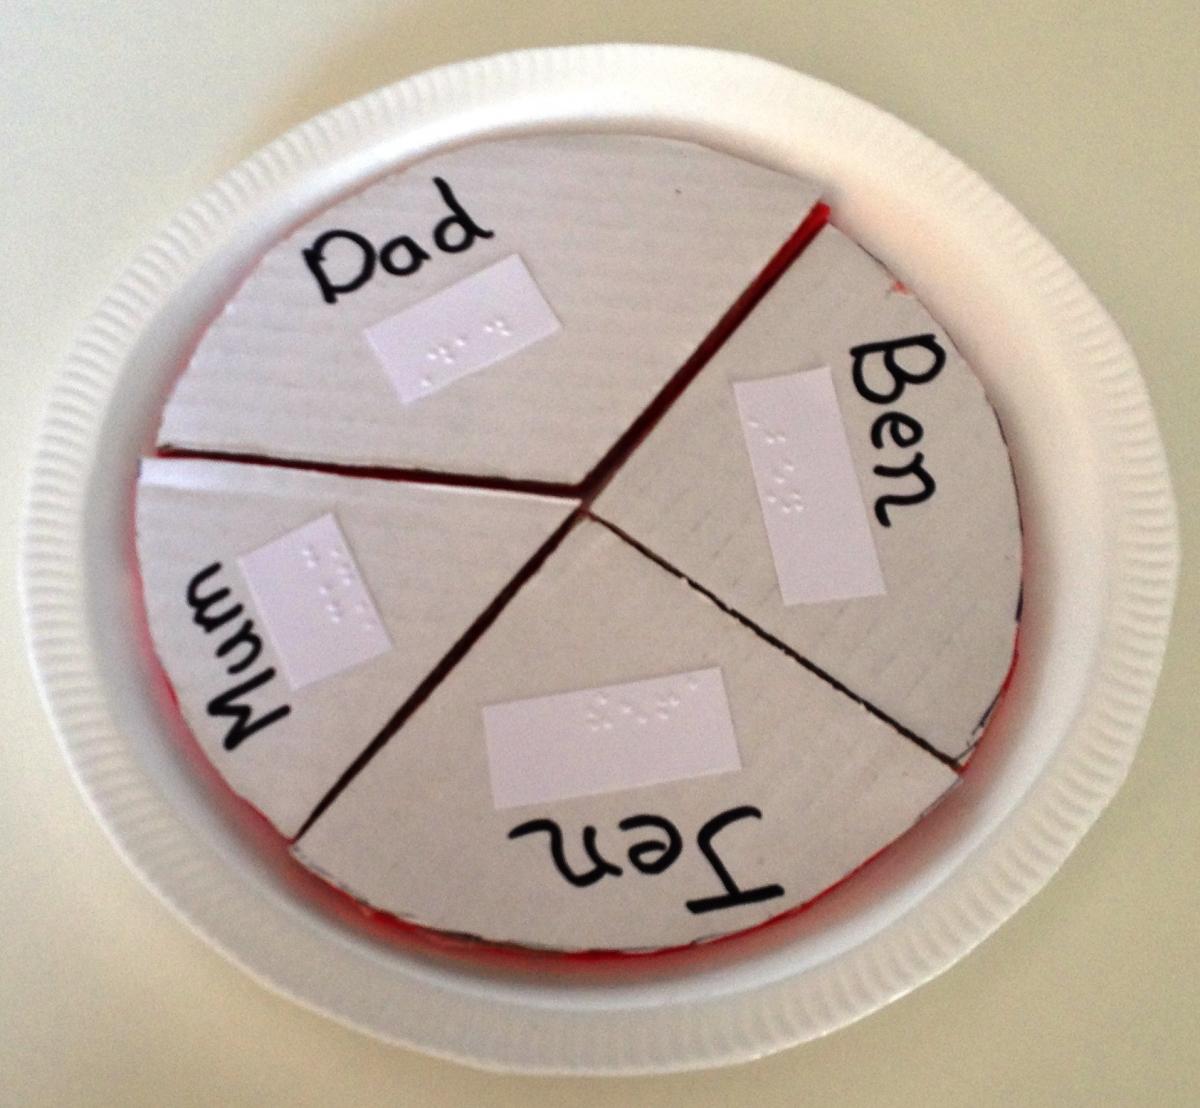
Paper plate with thick cardboard used to make the "pie pieces"
Example question:
My first pie chart
Ben and Jen made a jam pie. They cut it up.
They gave some to mum and dad.
1. How many pieces can you count?
2. Which pieces are the same?
3. Who had the biggest piece?
4. Who had the smallest piece?
|
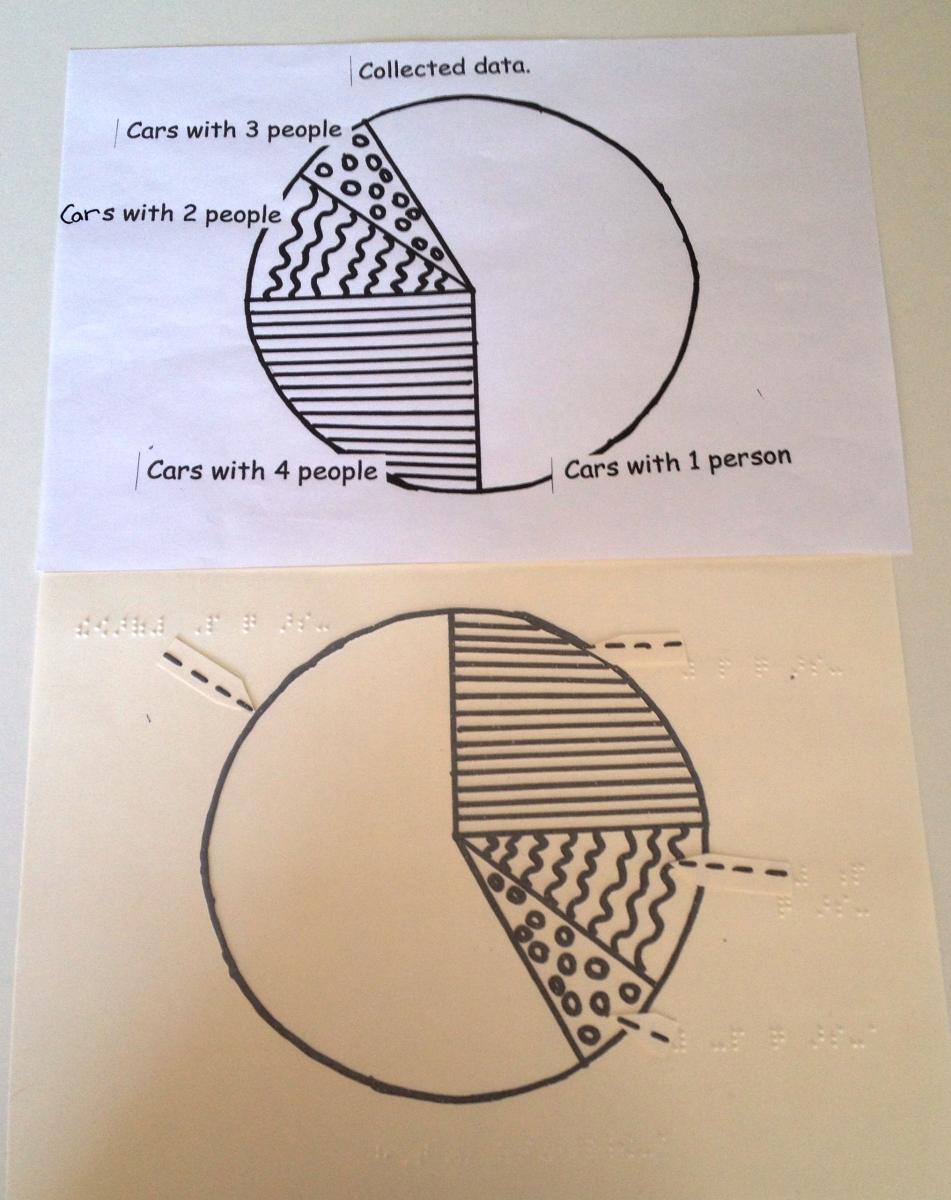
  Further examples of pie charts:
Tactile colour used to identify each area of the pie chart. (Image on left)
Made on Zyfuse paper, lines raised using Zyfuse machine. (Image on right)
|
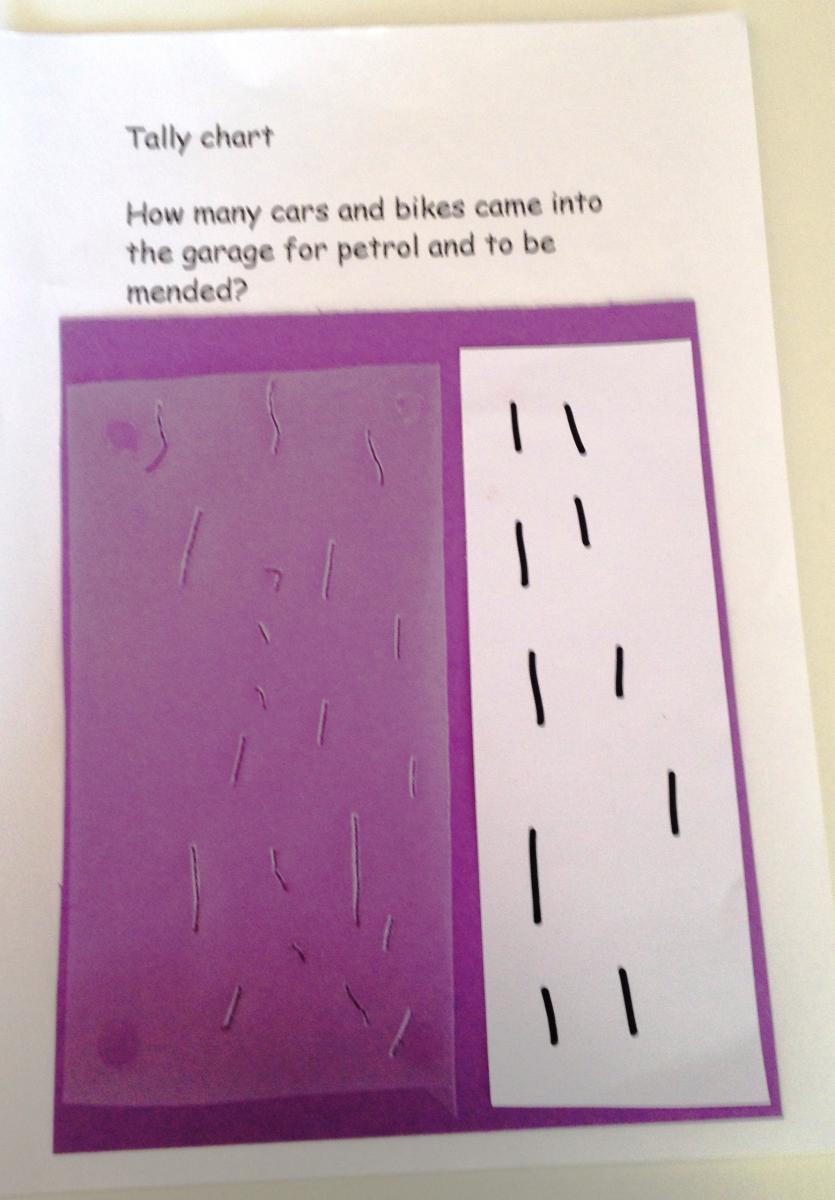
Tally Charts
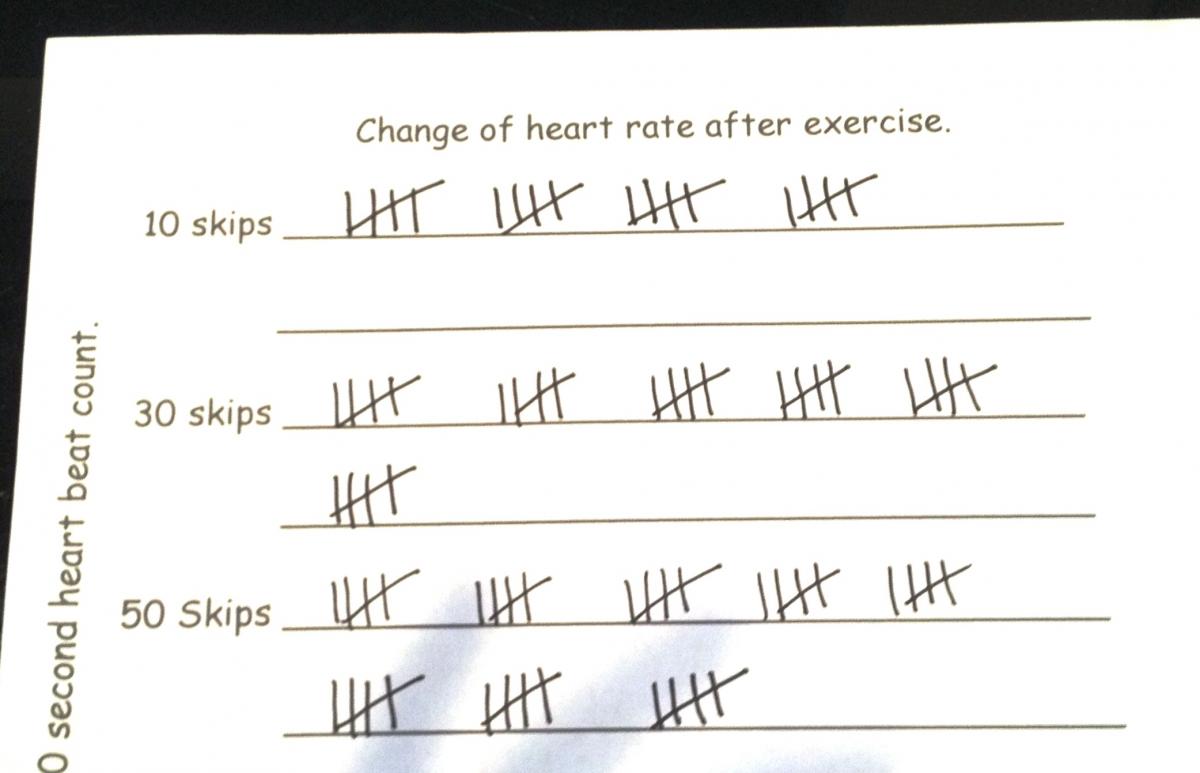
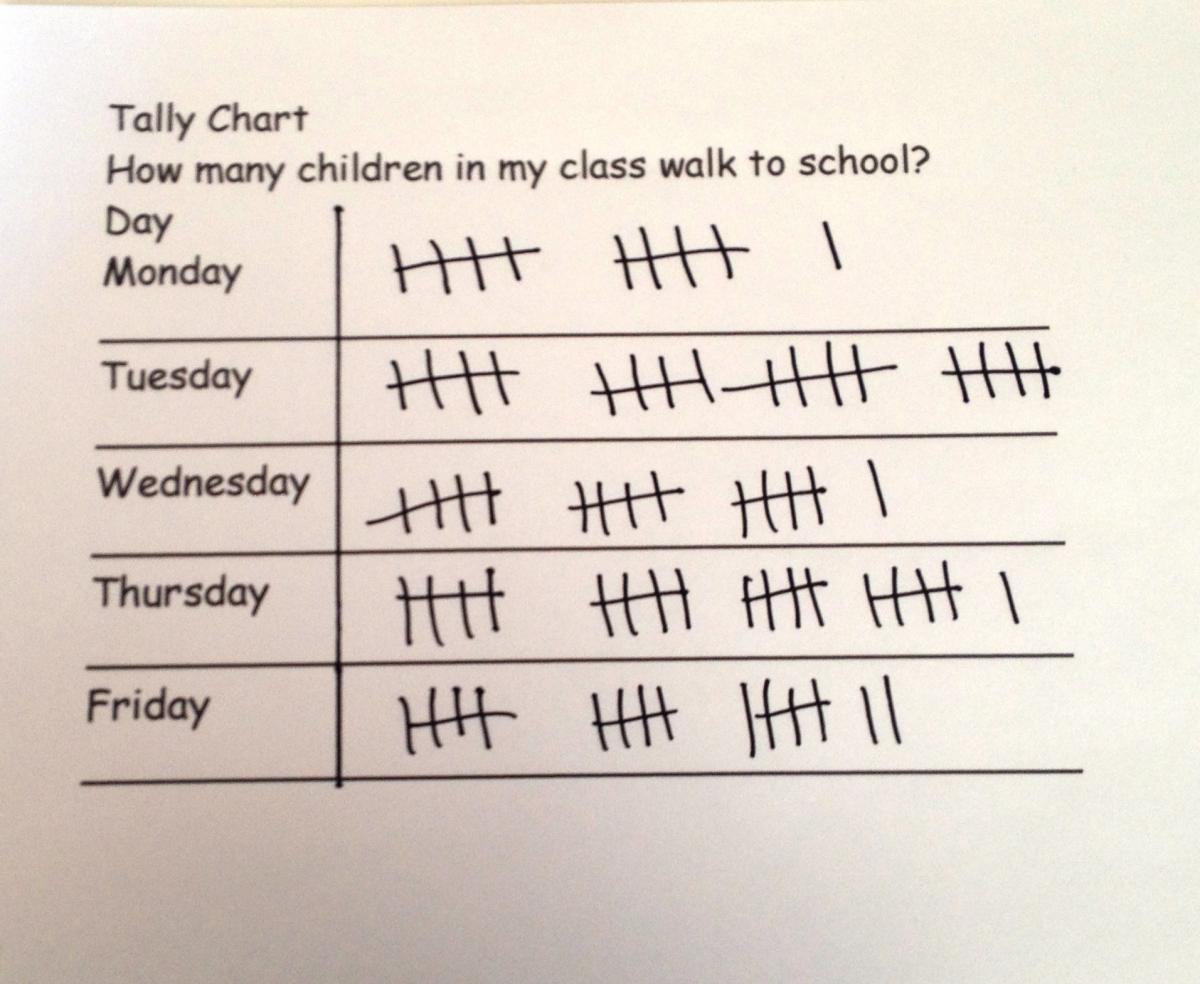
Tally chart using the letter ‘l’ to represent one, e.g. 10 skips: 5 ‘l’s’ in a group—space—5 ‘l’s in a group—space-5 ‘l’s in a group
Secondary—Tally Chart Large print
|
Bar Charts
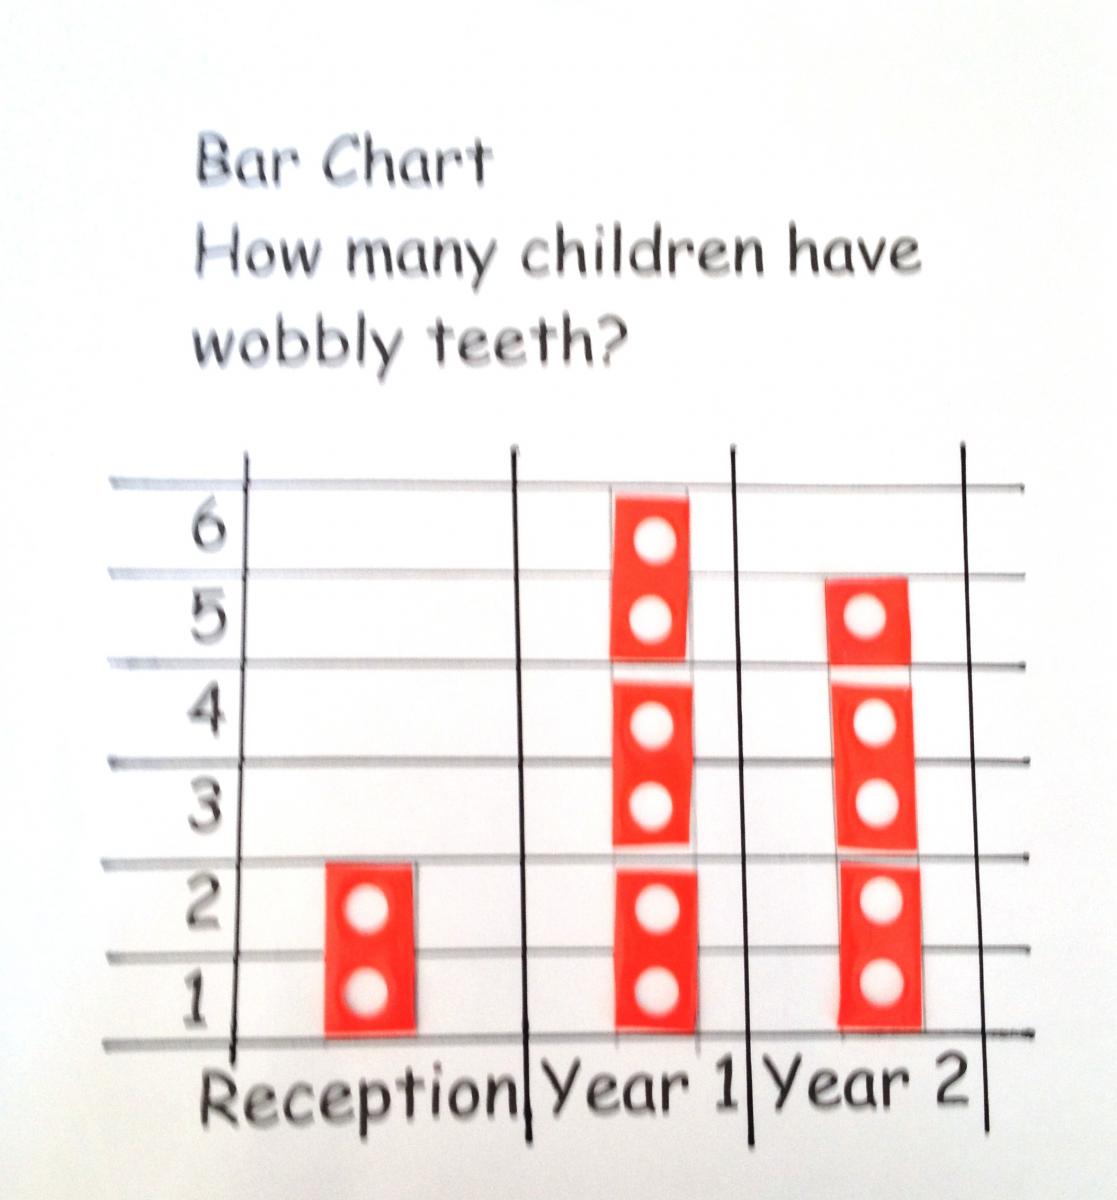
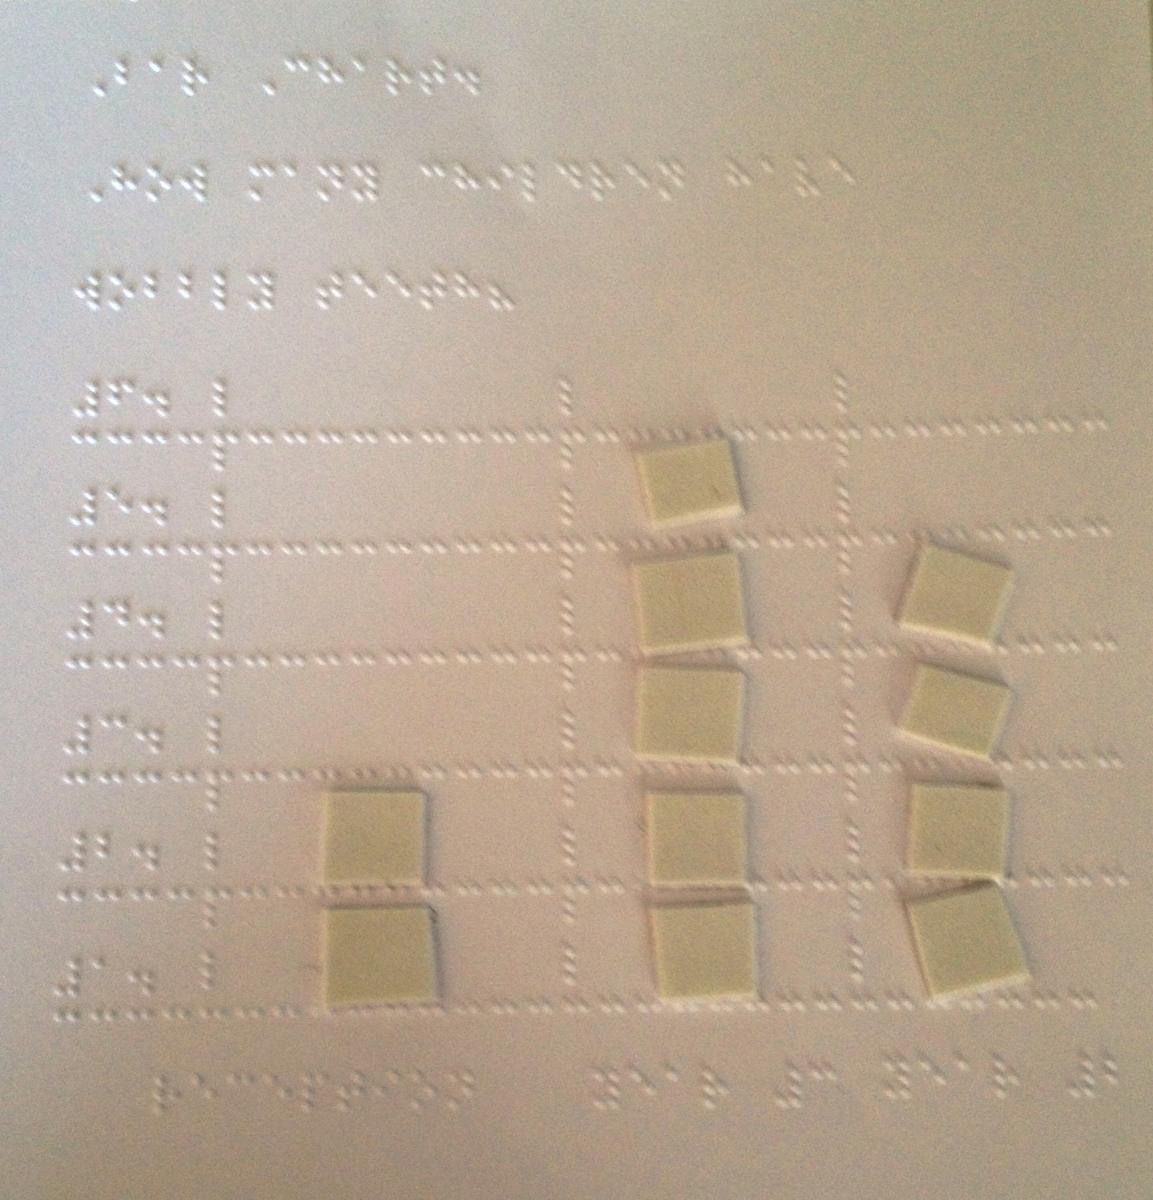
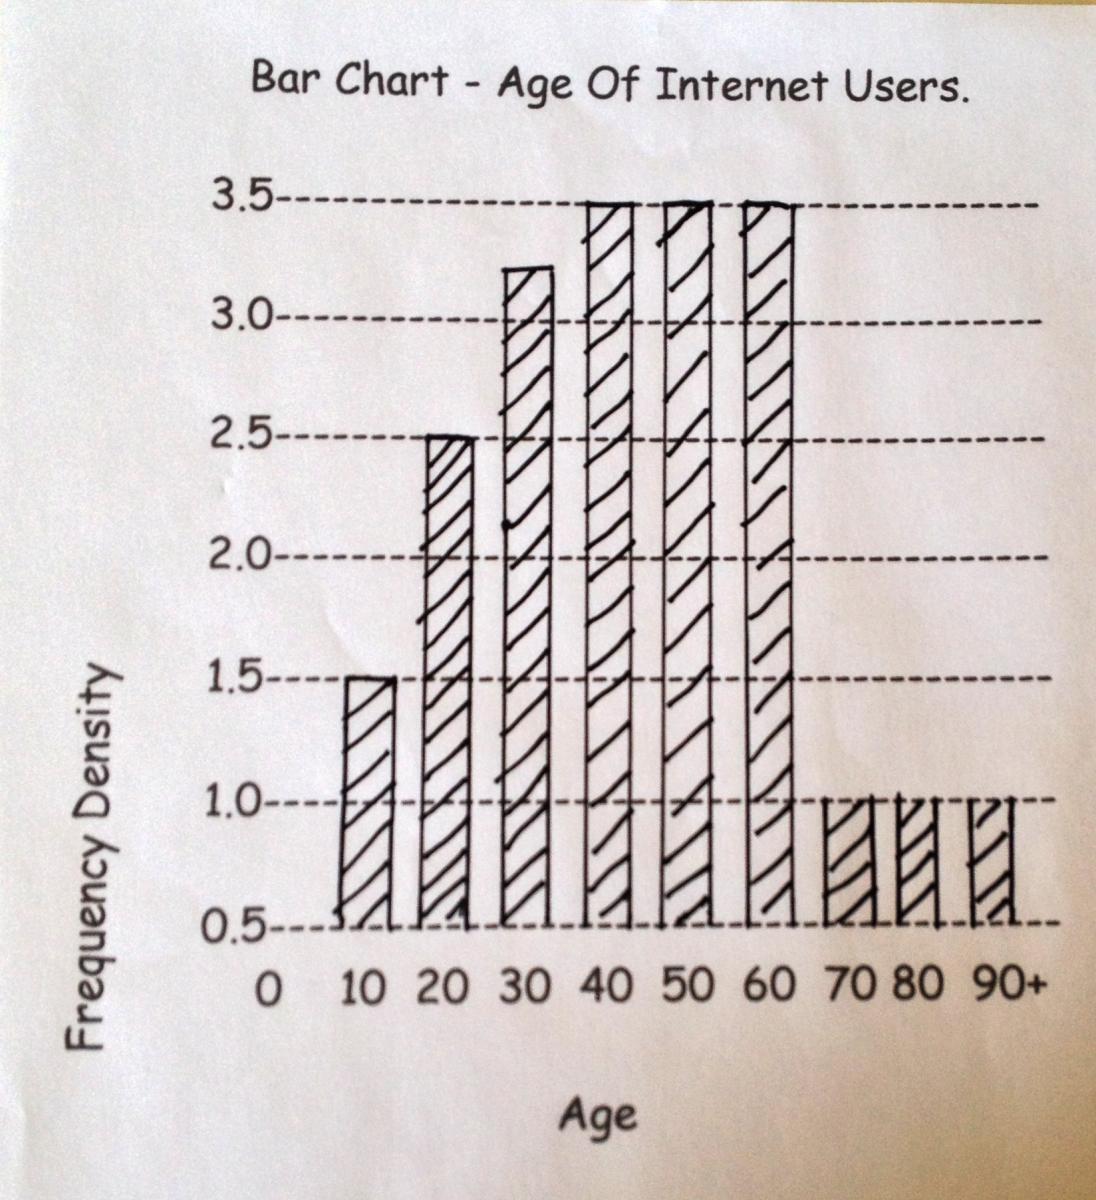
Primary Bar Chart - tactile version (right)
Braille version made using Perkins Braille Machine to create the lines. Braille numbers added directly using Perkins. Foam squares used to make the bars of the graph.
Large print bar chart (left) |
|
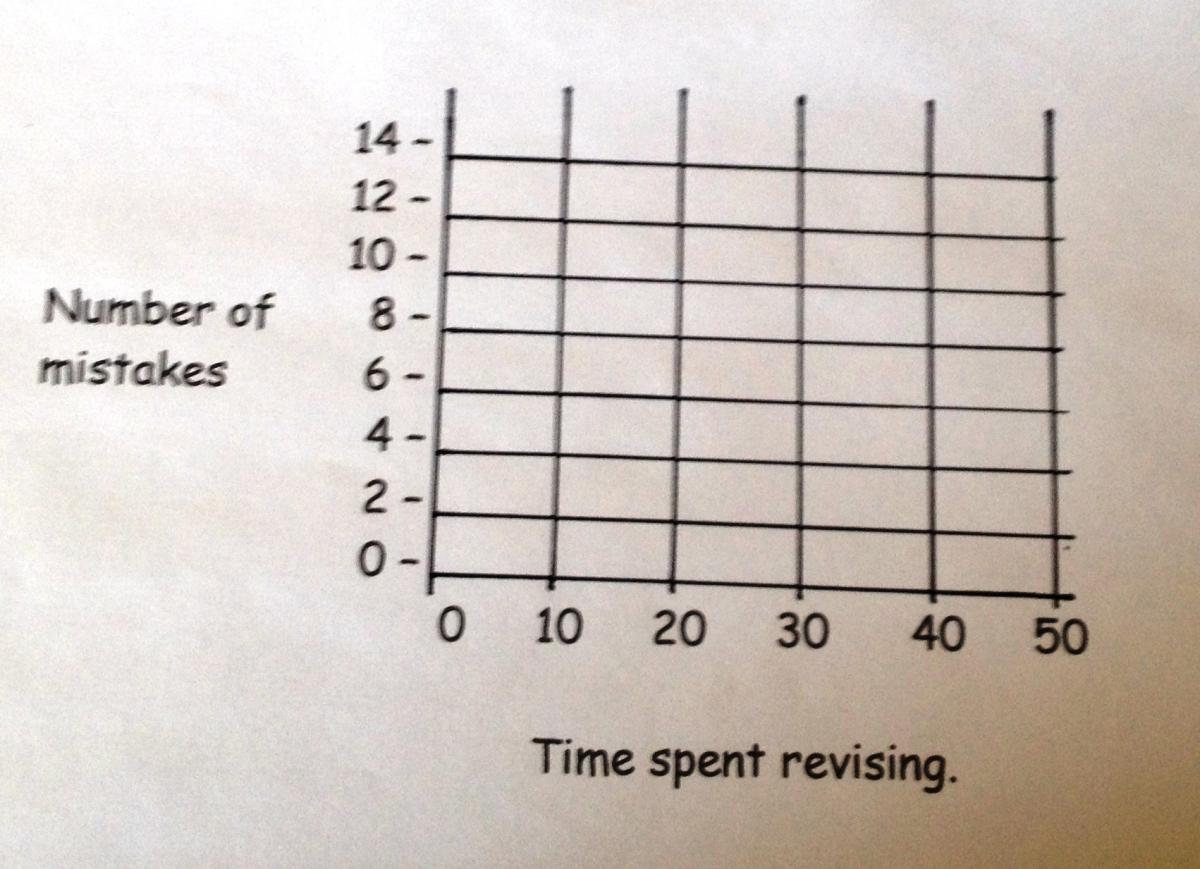
Co-ordinates
|
Tactile
On embossing film, lines drawn with biro, with embossing film positioned on geometry mat. Braille added directly onto film using Perkins Braille Machine. Co-ordinates can be plotted by positioning the embossing film on a cork mat using mapping pins to identify the locations.
Large print version of co-ordinates
|
Line Graphs
|
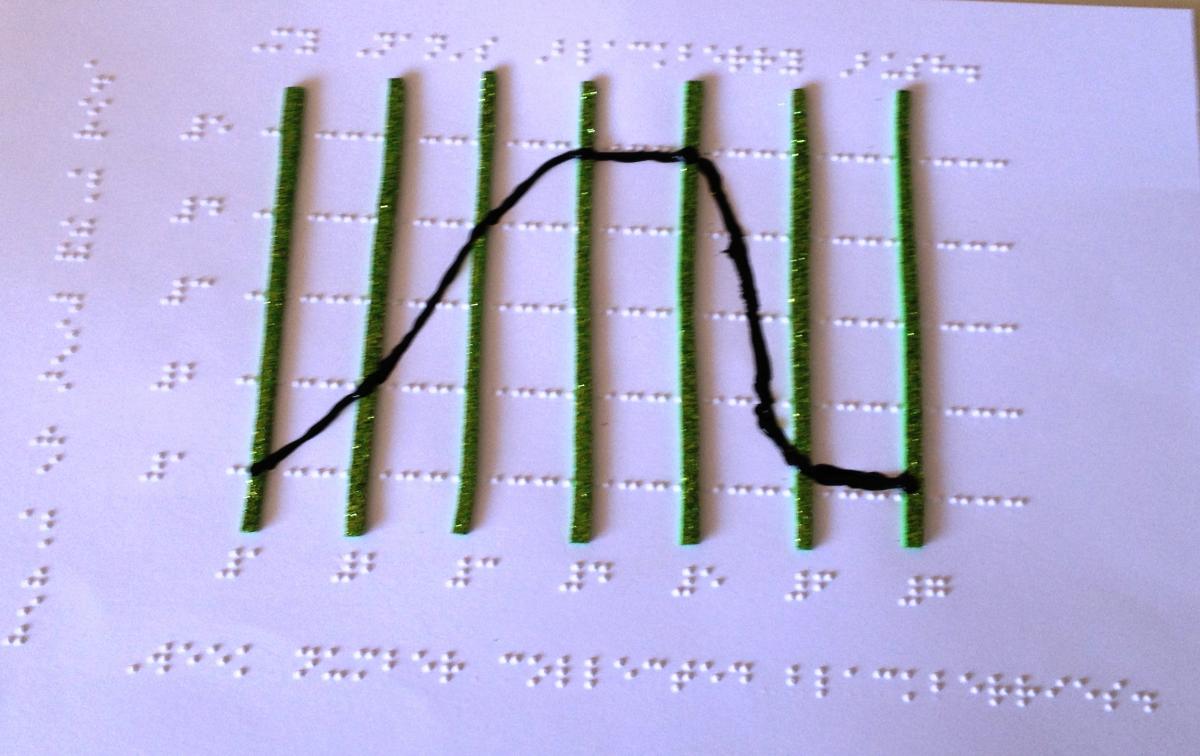
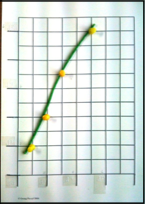
Tactile
Lines brailled with Perkins Braille Machine. Thin strips of foam used to highlight the columns, hi- mark used to indicate graph line Braille numbers added using Perkins Braille Machine
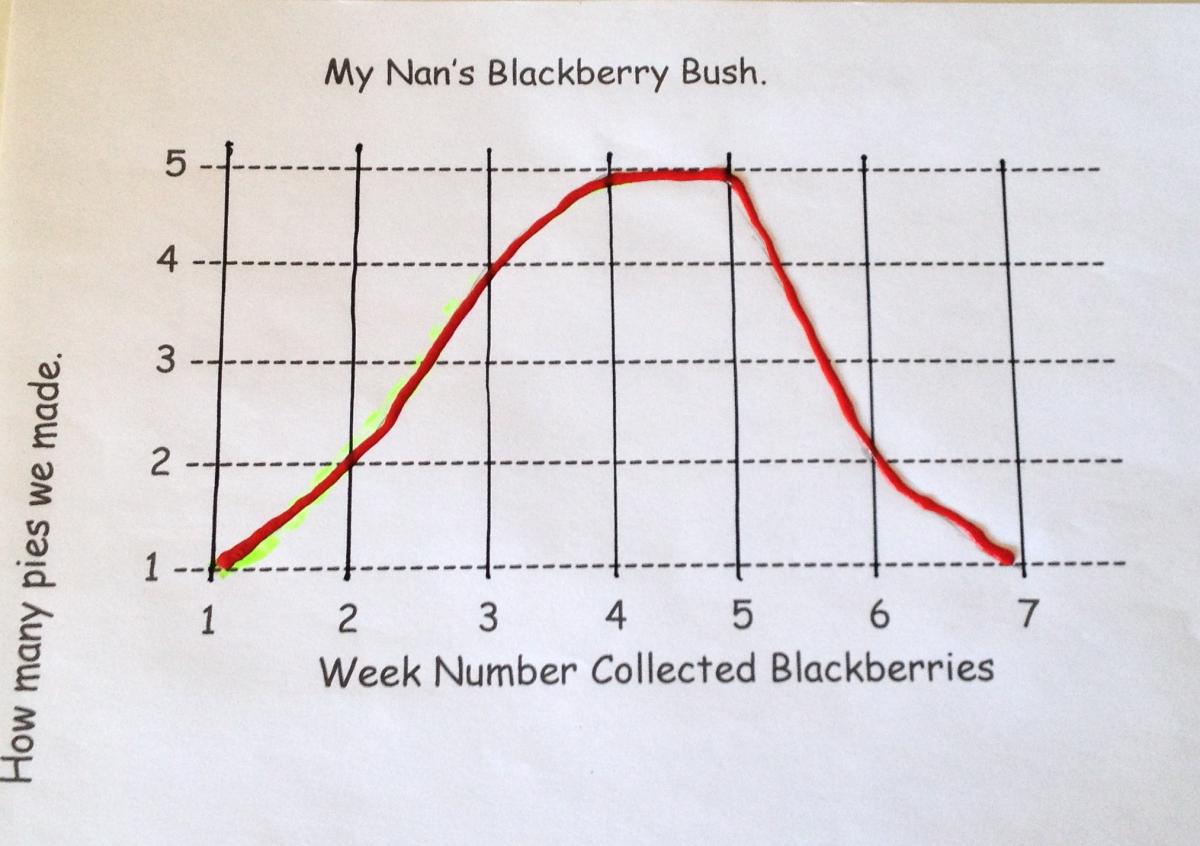
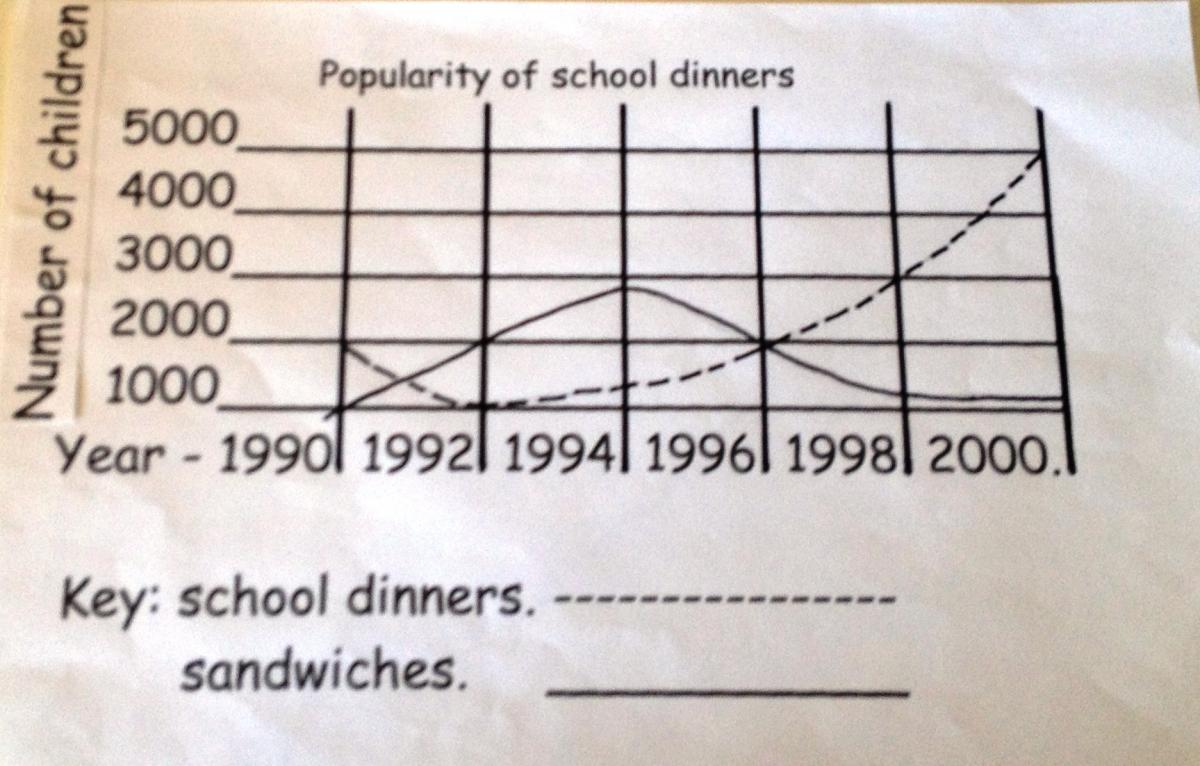
Large print version of line graph
Hi-Mark used to indicate line.
|
|
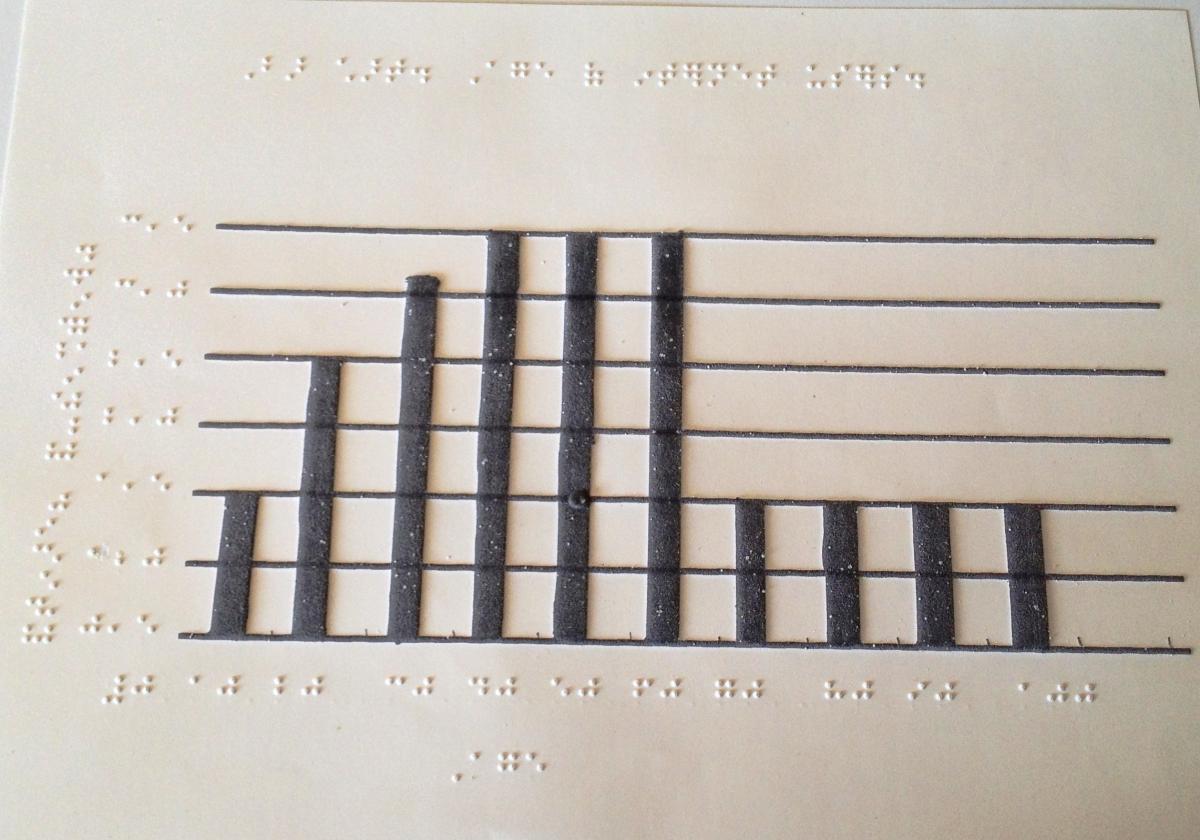
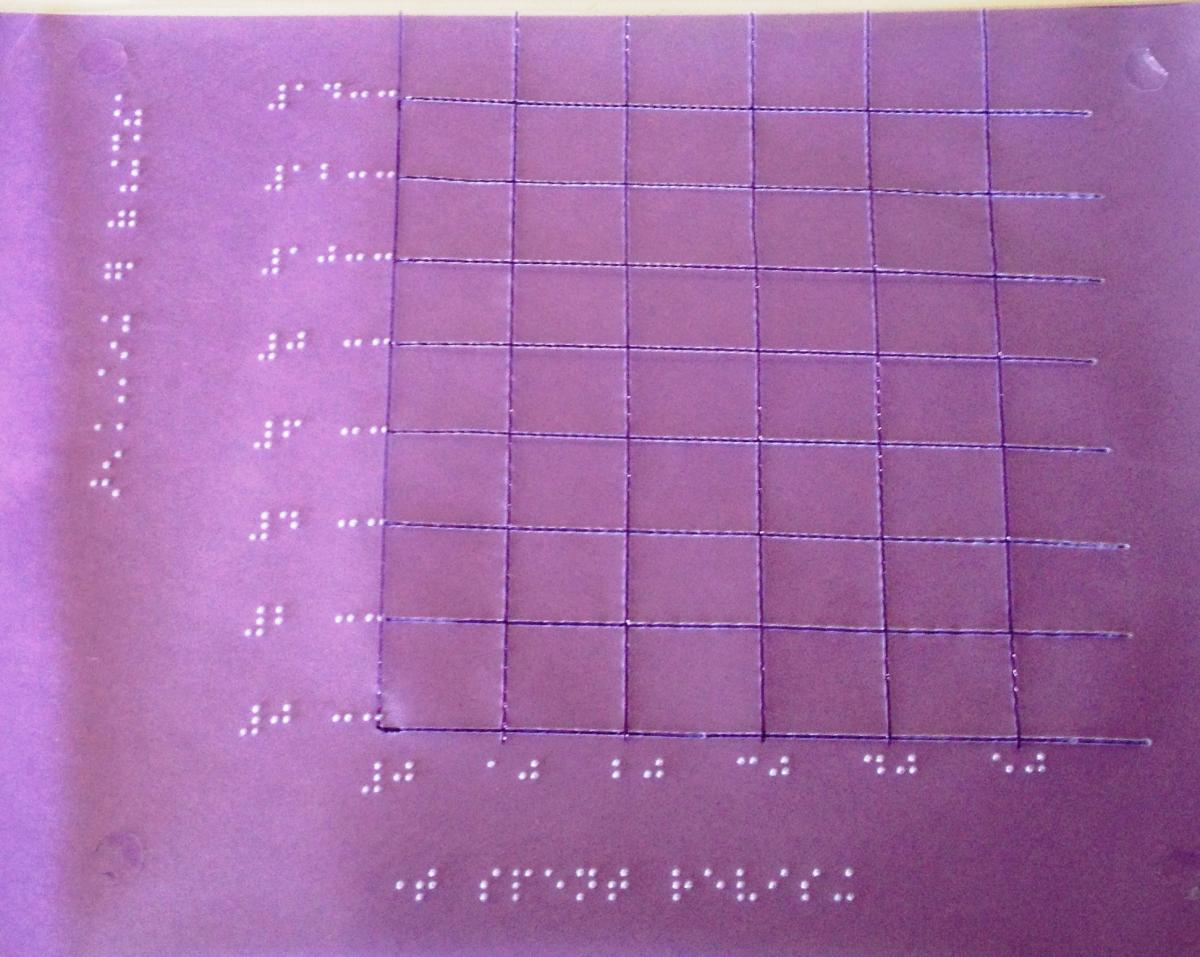
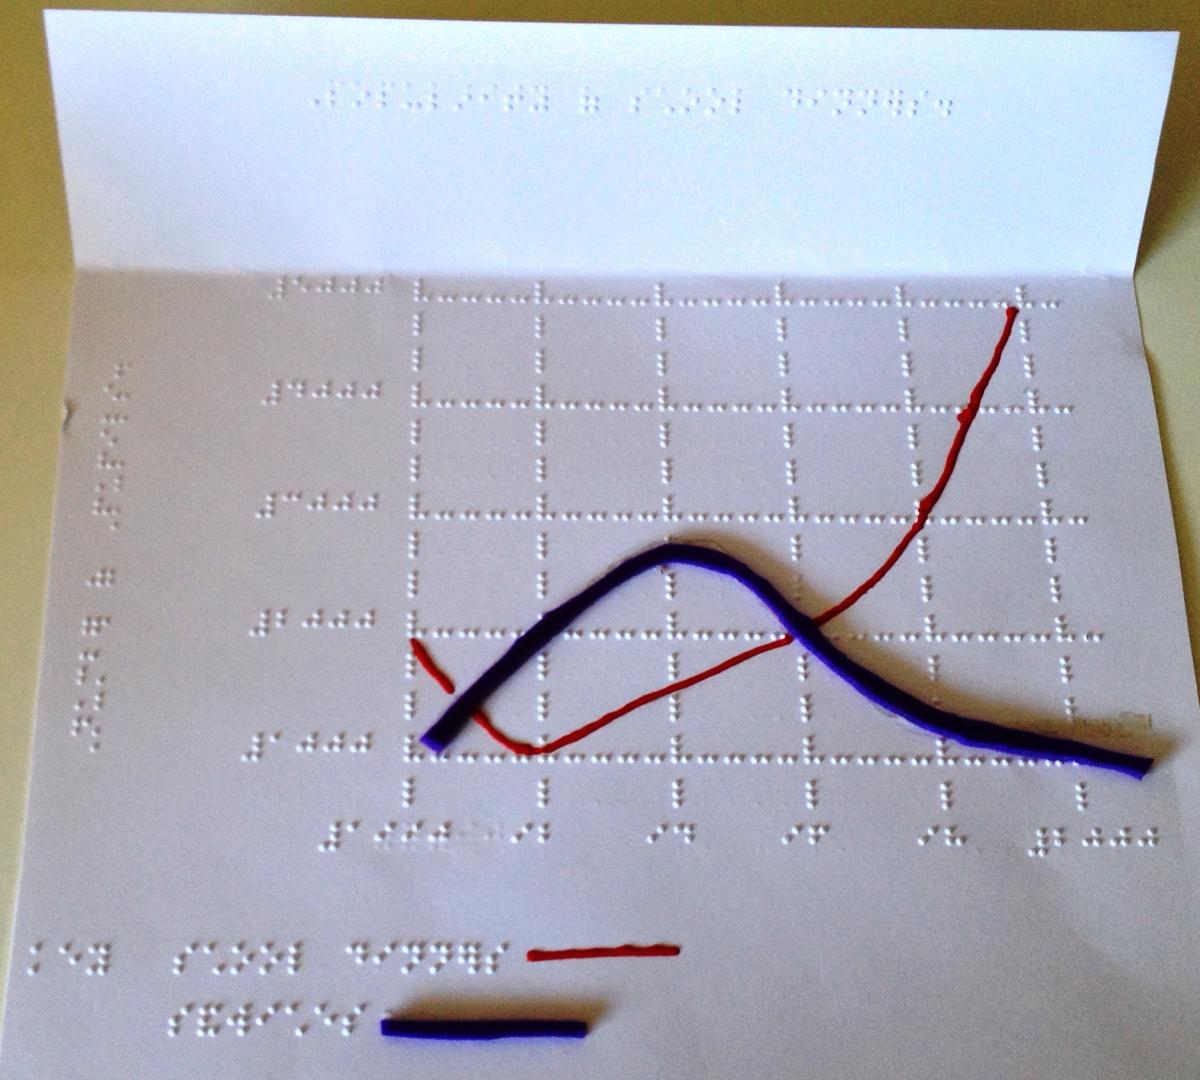
Tactile (right)
Grid lines made using Perkins Braille Machine, braille added directly using Perkins. Two types of line materials used to show clear distinction between the two. (Hi-Mark and foam strip, Wikki Stix could also be used.)
|

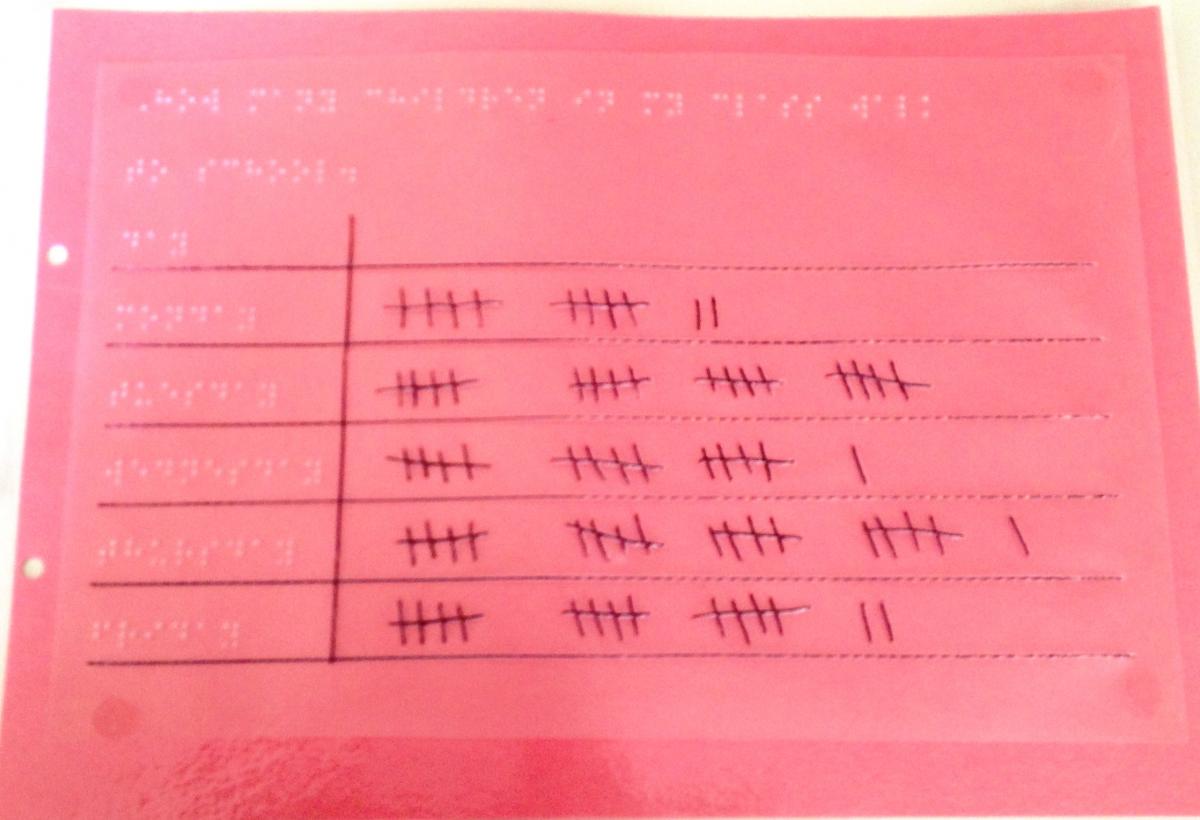
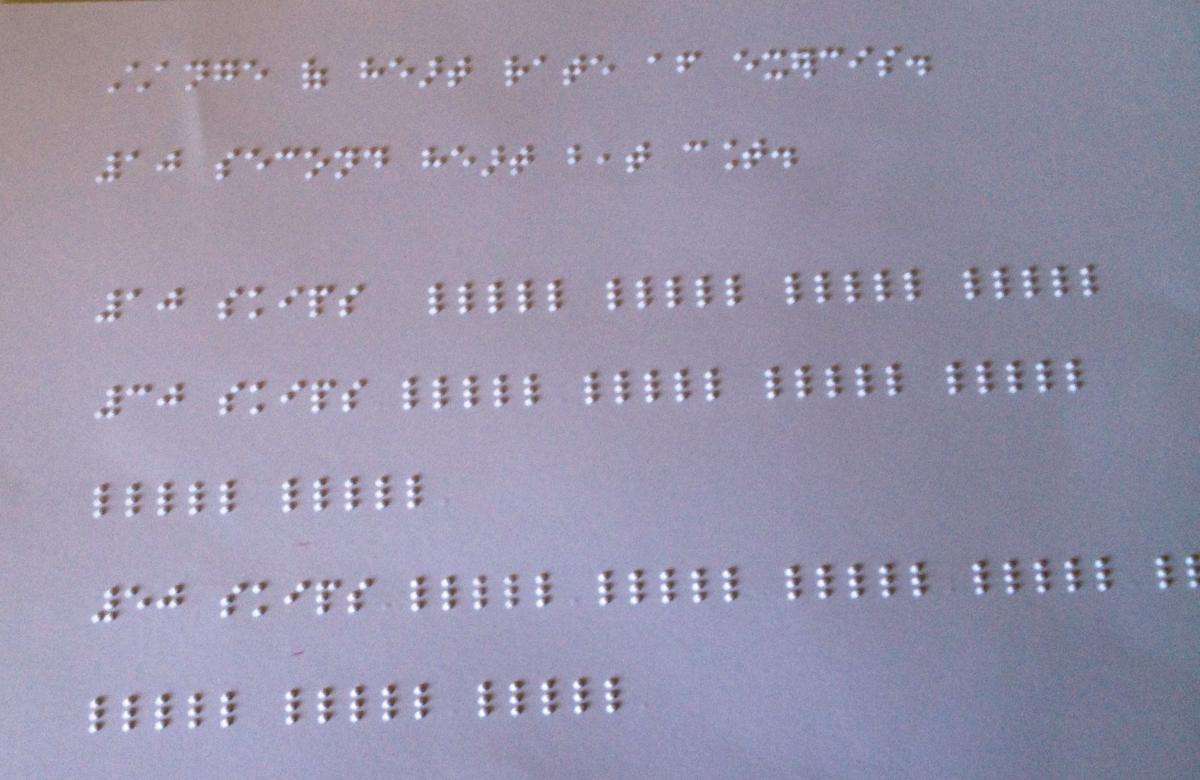 Secondary—Tally Chart Tactile